I’ve seen too many traders get blindsided by price crashes they never saw coming.
You’re staring at candlesticks and trend lines thinking you’ve got the full picture. But you’re missing half the story.
Most chart analysis teaches you patterns. Support levels. Resistance zones. Moving averages. That’s fine. But it doesn’t tell you why a coin suddenly drops 40% overnight when the technicals looked perfect.
Here’s what changes everything: the security layer beneath those charts.
When a blockchain gets compromised or a protocol shows cracks, the chart tells you after the damage is done. I’m going to show you how to read those signals before they become obvious.
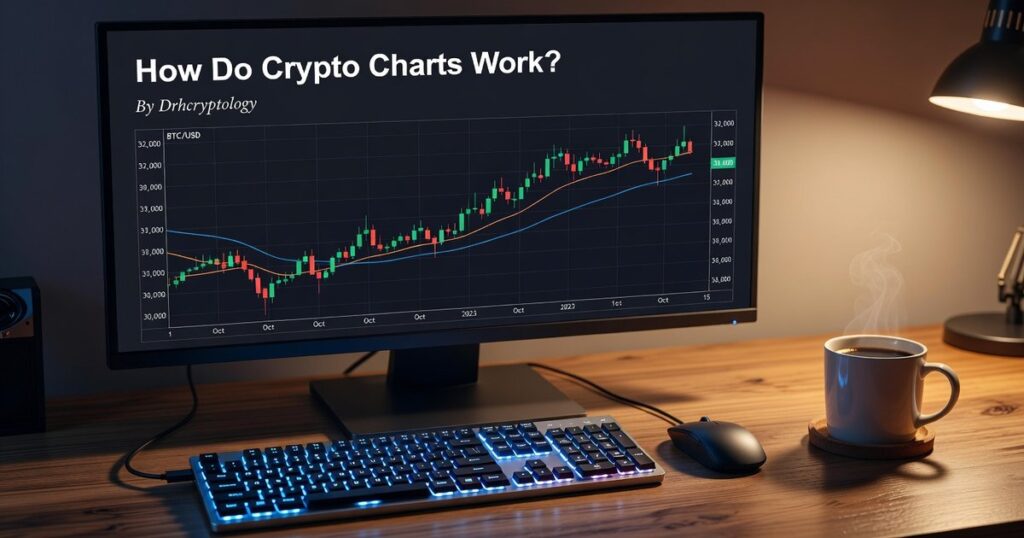
How do crypto charts work drhcryptology connects price action to what’s actually happening in the code and consensus layers. That’s where real risk lives.
I’ve spent years analyzing blockchain systems at the technical level. Not just watching prices move. Understanding what makes them move.
This guide teaches you to read charts differently. You’ll learn to spot the security events that trigger major price swings before they show up as red candles.
No hype. No moon predictions.
Just a better way to see what’s really happening with your investments.
The Anatomy of a Crypto Chart: Core Concepts for Beginners
Most people look at a crypto chart and see chaos.
Red and green bars everywhere. Lines going up and down. Numbers that don’t make sense.
I remember staring at my first Bitcoin chart thinking the same thing. It looked like someone threw paint at a wall and called it data.
But here’s what changed everything for me.
Once you understand what you’re actually looking at, charts stop being confusing. They start telling you a story about what traders are doing right now.
Let me break down how do crypto charts work Drhcryptology style. No jargon. Just the stuff that matters.
Understanding Candlesticks
Each candlestick shows you four numbers. Open, High, Low, and Close.
The body of the candle (the thick part) shows where price opened and where it closed. If it’s green, price went up during that period. Red means it went down.
The thin lines sticking out? Those are called wicks. They show you the highest and lowest points price hit before settling.
A long green candle means buyers were in control. A long red one means sellers dominated. Simple as that.
The Power of Volume
Volume bars sit at the bottom of most charts. They tell you how many coins changed hands during each period.
Here’s why this matters.
If price jumps 10% on massive volume, that move probably has legs. Lots of people are backing it with real money.
But if price jumps 10% on tiny volume? That’s suspect. It might reverse fast because not many people actually believe in the move.
Think of volume as conviction. High volume confirms what the price is telling you.
Essential Technical Indicators
Moving Averages smooth out all the noise. They average price over a set number of periods (like 50 or 200 days) and plot it as a line.
When price sits above the moving average, the trend is probably up. Below it? Trend is down.
Relative Strength Index (or RSI) runs from 0 to 100. Above 70 usually means overbought. Below 30 means oversold.
Overbought doesn’t mean sell right now. It just means price has run hard and might need a breather. Same logic applies to oversold conditions. In the world of Drhcryptology, understanding that overbought conditions indicate a potential pause rather than an immediate sell-off can be the key to navigating market fluctuations effectively.
These aren’t crystal balls. They’re just tools that help you see what’s happening beneath the surface.
The Critical Link: How Cryptography Security Manifests on Price Charts
Your charts are telling you something.
Most traders stare at candlesticks looking for patterns. They draw support lines and hunt for breakouts. But they miss what the price is actually screaming at them.
Security.
Every candle on your screen is a vote. A real-time referendum on whether the market trusts a project’s code. Whether investors believe their money is safe.
I’ve watched this play out dozens of times. A project looks solid on paper. The tech sounds good. Then the chart starts whispering that something’s wrong before anyone even knows what it is.
When Security Breaks, Charts Don’t Lie
You want to know what a hack looks like? It’s not subtle.
A long red candle drops like a stone. Volume explodes. We’re talking 10x or 20x normal trading activity in minutes. The sell orders pile up so fast that the order book looks like it’s been gutted.
This is the exploit signature. When a smart contract gets drained or a 51% attack hits, the chart shows you the exact moment trust dies. No press release needed.
I saw this with how do crypto charts work drhcryptology covers these events. The price action tells the story before the postmortem reports come out.
But here’s what most people don’t catch. Security problems show up on charts before the exploit even happens.
News breaks about a potential vulnerability. Maybe a researcher flags something in the code. Or a patch gets delayed. The chart doesn’t crash immediately. Instead, you get sustained pressure. Steady selling. Lower highs.
This is the vulnerability discount pattern. Watch for descending triangles forming over days or weeks. Each bounce gets weaker. Buyers lose interest because they’re not sure if their position is safe.
The market prices in risk before most investors even read the headlines.
Now flip it around.
A project announces a clean audit from a respected firm. Or they roll out a major security upgrade. Maybe they partner with a top cybersecurity company. The chart shifts.
You’ll see accumulation. Not a pump. Steady buying that builds over time. Higher lows. Bullish flags and ascending triangles. This is the security upgrade rally, and it reflects something real: confidence coming back.
The price isn’t just moving randomly. It’s showing you that smart money believes the project is safer now than it was yesterday.
A Step-by-Step Framework for Security-Focused Analysis
Most traders look at charts and see candles and lines.
I see something different.
Every price movement tells a story. And in crypto, security events write some of the biggest chapters.
You want to know how do crypto charts work drhcryptology style? It starts with understanding that price action doesn’t happen in a vacuum. A sudden drop isn’t random. A breakout isn’t just luck. To truly grasp how crypto charts work in the intricate world of Drhcryptology, one must delve into the nuances of market movements, which is where Cryptocurrency Advice Drhcryptology proves invaluable in deciphering the underlying trends that drive price action.
There’s usually a reason. And in this space, that reason is often tied to security.
Let me walk you through my framework.
Step 1: Run Your Security Check First We explore this concept further in Drhcryptology Bitcoin Tips From Drhomey.
Before you even open a chart, do this. Check if the project had a recent audit. Look for exploit reports. Scan the last 30 days of security news.
This takes five minutes. But it changes everything about how you read the chart.
Step 2: Find Your Macro Trend For the full picture, I lay it all out in Why Choose Cryptocurrency Drhcryptology.
Pull up your 50-day and 200-day moving averages. These tell you the big picture. Is this asset climbing or falling overall?
Don’t skip this. You need context before you dig into the details.
Step 3: Match Price to Security Events
Now here’s where it gets interesting.
Take those security dates you found in Step 1. Find them on your chart. What happened to price that day? What about the week after?
A hack announcement should show up as a red candle with heavy volume. An audit report might precede a green run. If you don’t see these correlations, something else is driving price.
Step 4: Confirm With Your Indicators
Use RSI and volume to back up what you’re seeing. If price tanked after bad news, check if RSI hit oversold levels. Look at whether sell volume spiked.
When everything lines up, you’ve got a strong signal.
This is how I analyze charts at binance exchange drhcryptology. Security first, then technicals.
Pro tip: Keep a spreadsheet of major security events and their price impacts. Patterns repeat more than you’d think.
The framework works because it accounts for what actually moves crypto prices. Not just lines on a screen.
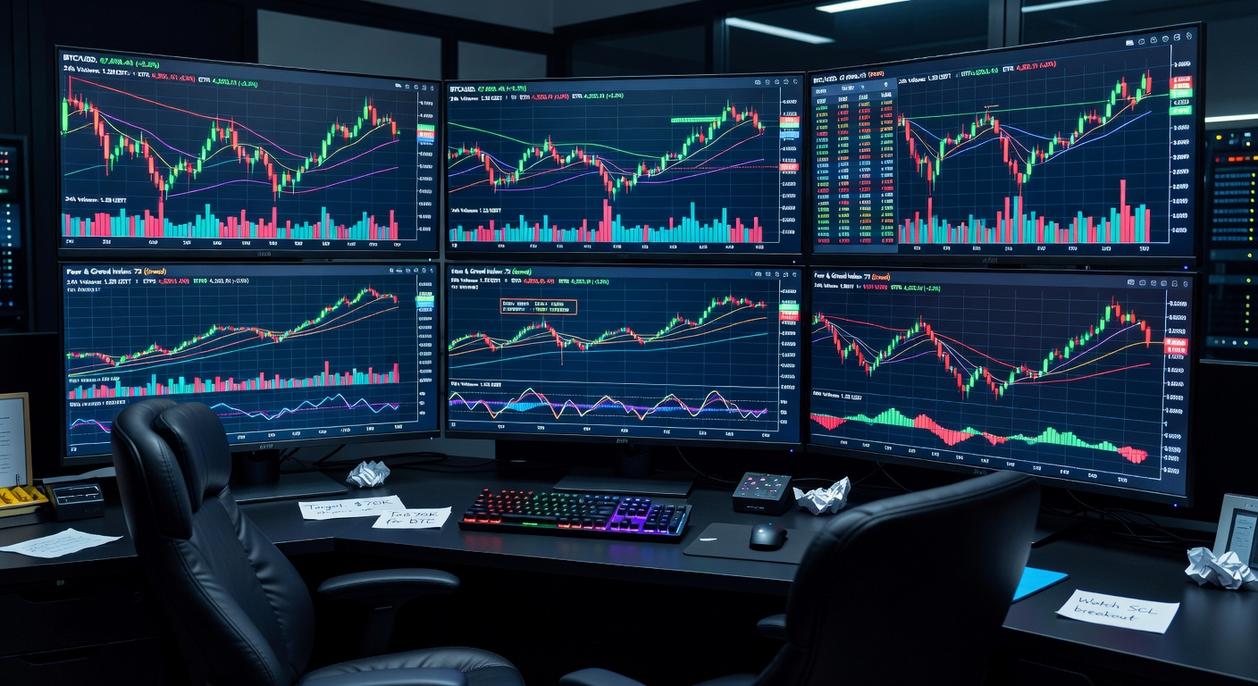
Essential Tools for Integrated Crypto Analysis
You can’t analyze crypto without the right tools.
I use TradingView for charting. It’s what most serious traders rely on because the interface is clean and the indicators actually work. You get real-time data across exchanges and can set alerts that matter.
But here’s what most people forget.
Technical analysis is only half the picture. You need to know when projects get compromised or when smart contracts fail audits. That’s where security monitoring comes in.
I check CertiK and PeckShield regularly. They publish audit reports and track exploits as they happen. When you see a pattern of vulnerabilities in a specific protocol type, that’s information you can act on.
Now you might be wondering how do crypto charts work drhcryptology and what all those candlesticks actually mean. That’s a whole separate skill set. But once you understand price action, you’ll want to cross-reference it with security data.
Think about it this way. A coin might look bullish on the charts. But if the project just failed an audit or got flagged for suspicious contract code? That changes everything.
So what’s next after you set up these tools?
You need a system for monitoring them daily without burning out. I spend 20 minutes each morning scanning security feeds and checking key chart levels. That’s it. You don’t need to watch screens all day. By integrating tools like Binance Exchange Drhcryptology into my daily routine, I can efficiently monitor market trends in just 20 minutes without the burnout of constant screen time.
The real edge comes from combining both sources of cryptocurrency advice drhcryptology teaches. Charts show you sentiment. Security reports show you risk.
Use both.
A Smarter Approach to Crypto Charting
You now have a complete process for analyzing crypto charts.
But here’s the thing: you can’t just rely on technical patterns. That’s like reading a map without checking the weather. You’re missing critical information that shapes the entire journey.
How do crypto charts work drhcryptology? They work best when you combine them with security intelligence.
Chart patterns show you price movement. Security data shows you why that movement might continue or collapse.
This dual-lens approach gives you a realistic view of an asset’s potential. You see both the technical setup and the underlying security story.
Most traders skip the second part. They look at candlesticks and indicators and think they have the full picture.
They don’t.
Here’s what you should do next: Before you analyze your next chart, pause. Ask yourself what security story the price is telling you. Check the cryptographic fundamentals. Look at network health and protocol security.
This isn’t extra work. It’s the work that separates informed decisions from blind guesses.
Start applying this approach today. Your future self will thank you when you avoid that next security-compromised project before it tanks.
The charts are only half the story. Now you know how to read the other half.
 Vynric Droshar writes the kind of crypto security practices content that people actually send to each other. Not because it's flashy or controversial, but because it's the sort of thing where you read it and immediately think of three people who need to see it. Vynric has a talent for identifying the questions that a lot of people have but haven't quite figured out how to articulate yet — and then answering them properly.
They covers a lot of ground: Crypto Security Practices, Blockchain Technology Insights, Crypto News and Developments, and plenty of adjacent territory that doesn't always get treated with the same seriousness. The consistency across all of it is a certain kind of respect for the reader. Vynric doesn't assume people are stupid, and they doesn't assume they know everything either. They writes for someone who is genuinely trying to figure something out — because that's usually who's actually reading. That assumption shapes everything from how they structures an explanation to how much background they includes before getting to the point.
Beyond the practical stuff, there's something in Vynric's writing that reflects a real investment in the subject — not performed enthusiasm, but the kind of sustained interest that produces insight over time. They has been paying attention to crypto security practices long enough that they notices things a more casual observer would miss. That depth shows up in the work in ways that are hard to fake.
Vynric Droshar writes the kind of crypto security practices content that people actually send to each other. Not because it's flashy or controversial, but because it's the sort of thing where you read it and immediately think of three people who need to see it. Vynric has a talent for identifying the questions that a lot of people have but haven't quite figured out how to articulate yet — and then answering them properly.
They covers a lot of ground: Crypto Security Practices, Blockchain Technology Insights, Crypto News and Developments, and plenty of adjacent territory that doesn't always get treated with the same seriousness. The consistency across all of it is a certain kind of respect for the reader. Vynric doesn't assume people are stupid, and they doesn't assume they know everything either. They writes for someone who is genuinely trying to figure something out — because that's usually who's actually reading. That assumption shapes everything from how they structures an explanation to how much background they includes before getting to the point.
Beyond the practical stuff, there's something in Vynric's writing that reflects a real investment in the subject — not performed enthusiasm, but the kind of sustained interest that produces insight over time. They has been paying attention to crypto security practices long enough that they notices things a more casual observer would miss. That depth shows up in the work in ways that are hard to fake.